
In today’s data-driven world, the ability to make informed decisions is paramount. Whether you’re a business professional, a data analyst, or just someone curious about your personal data, analytics tools have become indispensable. One such tool that empowers individuals and organizations alike is Microsoft’s Power BI. In this blog post, we’ll explore how Power BI can be a game-changer for everyday analytics, providing insights and visualizations that are accessible to everyone.
1. Introduction to Power BI
A. What is Power BI?
Power BI is a business analytics tool developed by Microsoft that enables users to visualize and analyze data, share insights across the organization, or embed them in an app or website. It brings together data from various sources, transforming it into actionable information.
B. Why is it relevant for everyone?
Whether you’re managing personal finances or overseeing business operations, Power BI’s user-friendly interface and robust features make it accessible and relevant for individuals from all walks of life.
C. Key features and capabilities
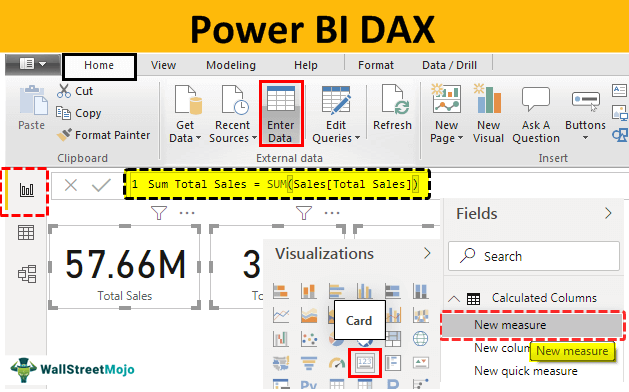
Power BI offers a range of features, including data connectivity, interactive dashboards, and powerful data modeling capabilities through its DAX language, making it a versatile tool for both beginners and advanced users.
2. Getting Started with Power BI
A. Installation and setup
Getting started with Power BI is easy. Download and install the desktop application, connect it to your preferred data source, and you’re ready to start exploring and visualizing your data.
B. Connecting to data sources
Power BI supports a wide range of data sources, from Excel spreadsheets to cloud-based databases. This flexibility allows users to integrate and analyze data from diverse platforms seamlessly.
C. Creating your first report
With an intuitive drag-and-drop interface, users can create visually appealing reports without the need for extensive technical skills. Power BI guides you through the process of building reports and dashboards.
3. Everyday Analytics Scenarios
A. Personal finance tracking
Power BI can be used to track and analyze personal expenses, providing insights into spending patterns, budget adherence, and future financial planning.
B. Sales performance monitoring
For businesses, Power BI can offer real-time insights into sales performance, helping teams track key metrics, identify trends, and make data-driven decisions to improve overall sales strategies.
C. Project management insights
Power BI’s project management capabilities allow users to visualize project progress, resource allocation, and timelines, facilitating better project oversight and decision-making.
4. Visualizations and Dashboards
A. Building compelling visuals
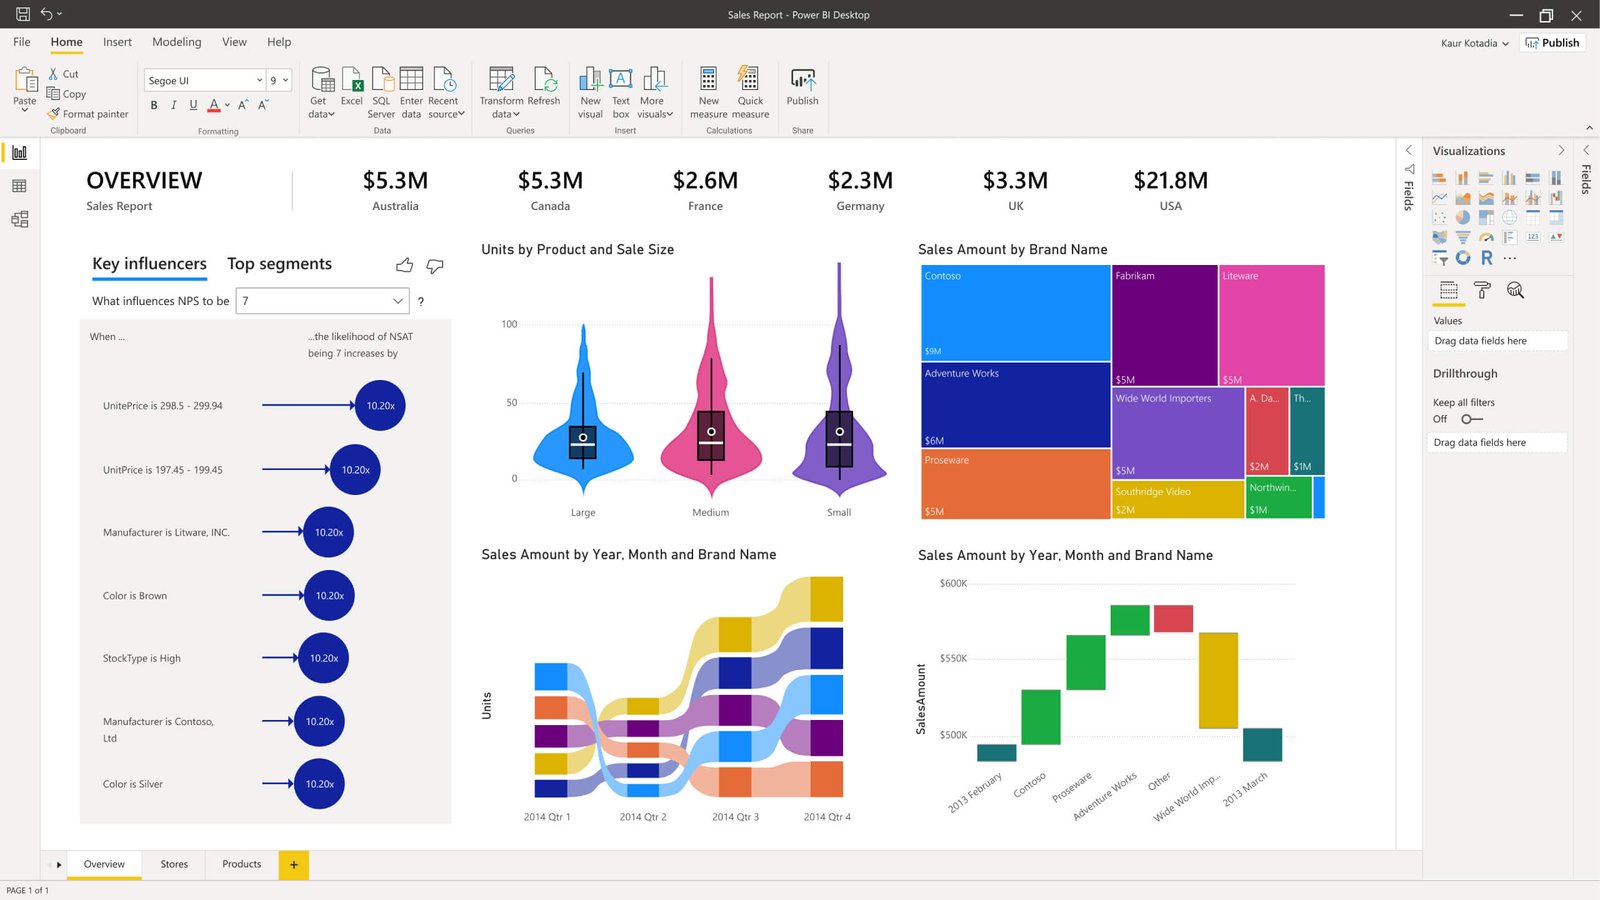
Power BI’s rich visualization options enable users to create compelling charts, graphs, and maps that bring data to life, making it easier to understand and interpret.
B. Customizing dashboards for your needs
Tailor your dashboards to specific requirements by customizing visuals, layouts, and themes, ensuring that the information presented aligns with your unique needs and preferences.
C. Sharing and collaborating on reports
Power BI’s sharing features enable users to collaborate seamlessly. Whether it’s sharing reports internally within a team or externally with clients, collaboration is simplified.
5. Power BI for Business Professionals
A. Analyzing business trends
Power BI’s analytical capabilities empower business professionals to identify trends, analyze market conditions, and make informed decisions to stay ahead of the competition.
B. Creating executive dashboards
For executives, Power BI provides a concise overview of key performance indicators, helping them track organizational goals and make strategic decisions based on real-time data.
C. Making data-driven decisions
With Power BI, business professionals can move beyond gut feelings and make decisions based on accurate and up-to-date data, reducing the risk of errors and enhancing overall decision-making.
6. Power BI for Data Enthusiasts
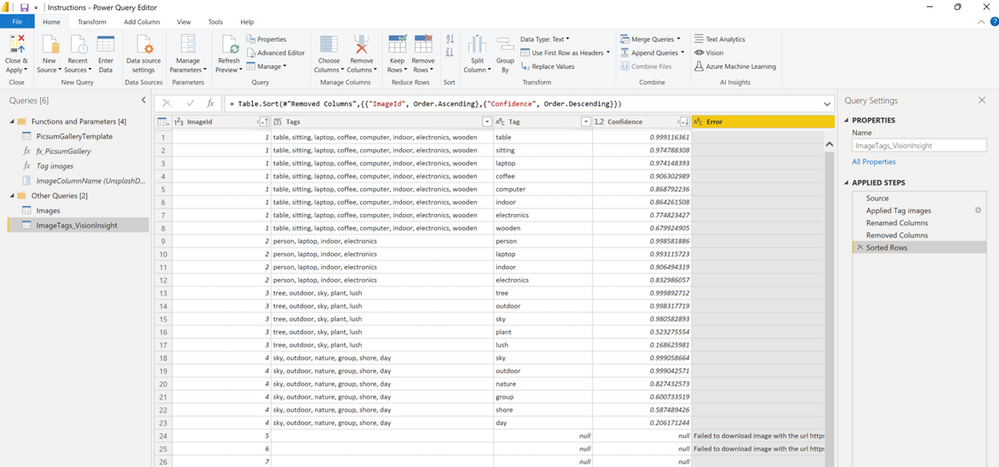
A. Exploring and analyzing datasets
Power BI’s robust data exploration tools allow data enthusiasts to dive deep into datasets, uncovering patterns, outliers, and correlations for a more comprehensive understanding.
B. Learning and mastering DAX (Data Analysis Expressions)
For those looking to enhance their analytical skills, mastering DAX opens up a world of possibilities in terms of creating complex calculations and custom metrics within Power BI.
C. Building advanced reports and insights
Power BI’s advanced features, coupled with a solid understanding of DAX, enable users to create sophisticated reports and gain deeper insights into their data.
7. Resources for Power BI Mastery
A. Online courses and tutorials
Platforms like Coursera offer courses like “Analyzing and Visualizing Data with Power BI,” providing a structured learning path for both beginners and advanced users.
B. Community forums and user groups
Engage with the Power BI community through forums and user groups to share experiences, ask questions, and stay updated on the latest developments in the Power BI ecosystem.
C. Books and documentation
“Power BI for Dummies” by Ken Withee and the official Microsoft Power BI Documentation serve as valuable resources for in-depth learning and reference.
Conclusion
Power BI has democratized analytics, making it accessible to individuals from various backgrounds. Whether you’re tracking personal expenses, monitoring business performance, or diving into complex data analysis, Power BI provides the tools and features needed for success. By investing time in learning and exploring Power BI, you can harness the power of data to make better decisions in your everyday life and professional endeavors.